Lean has become a key transformational buzzword in the apparel manufacturing industry. However, a lot of confusion exists in understanding the principles and applying them practically on the shopfloor. Understanding the connection between strategy and principles is the key to implement ‘Lean’ on the shopfloor. In this series of articles, Anand Deshpande, Founder and CEO – Admaa Consulting connects the principles with measurables and strategies to achieve those measurables on the apparel shopfloor. In short, it provides a structured approach to design a Lean process and suggest major factors and strategies to consider in doing so.
As one enters an apparel factory, he/she can see the following scenes:
• Materials waiting to be processed in front of a machine or an operator.
• Operator being starved of materials (idle time for the operator).
• Excess material in finished goods super market waiting to be sold.
• Longer delivery times due to excessive WIP and colour clearance issues.
• Quality issues indicated by piles of garments waiting to be reworked.
Any production manager would want the factory to be in perfect harmony by balancing operations, and optimally considering the company’s objectives and goals. Lean process design creates harmonic balance within and between processes.
The three broad steps to design a Lean process are: First, to establish the guiding principles for designing a Lean process, define goals and objectives of lean design process, and identify the measurables at plant and department levels. Second, to devise a plant-wide strategy; and the third step is to devise a department-wide strategy.
In this first part of the three-part series, we will discuss the first three steps…
1. Establish guiding principles for designing a Lean process
A lean process is an outcome of operational excellence which is a result of application of specific tools and techniques day in and day out.
Generally speaking, the guiding principles are:
• Eliminate waste continually.
• Align production capacity to match the customer demand.
• Increase the speed of the material through the production system.
• Standardize processes for consistent results.
• Reduce WIP (Work in Progress) between and within processes.
• Introduce positive constraints.
• Reduce transfer distance of materials between and within departments.
• Workplace organization.
2. Lean process guiding principles transform themselves into objectives for successful implementation. The objectives are:
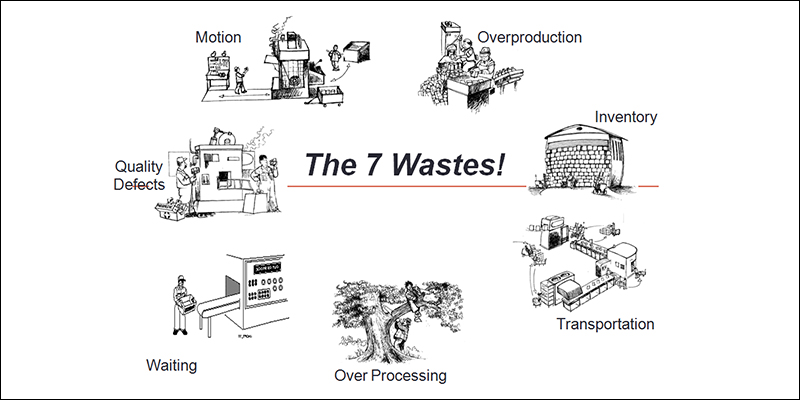
• Waste Elimination.
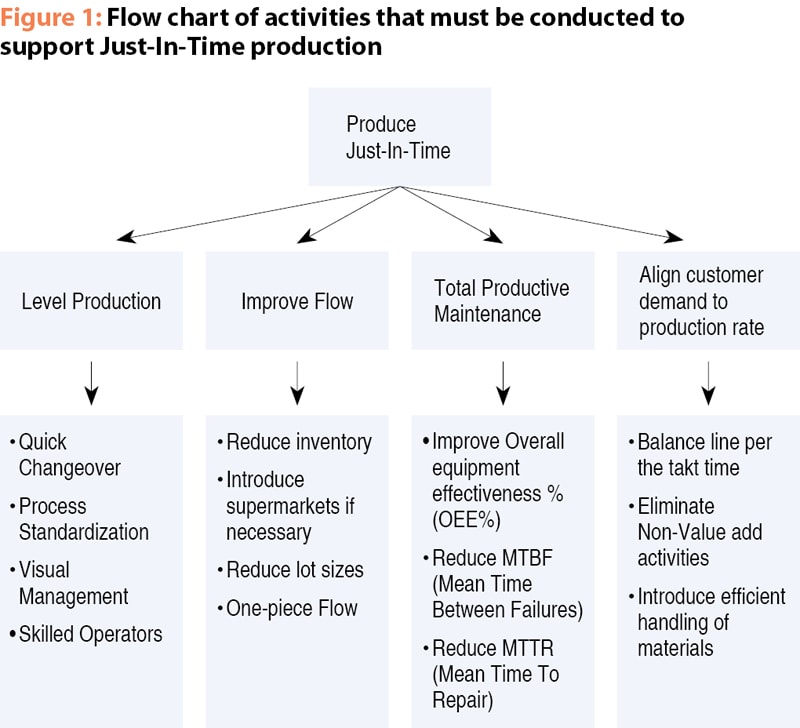
• Produce Just-In-Time.
Producing to Just-In-Time means producing the required part or component in the right time and in the right amount.
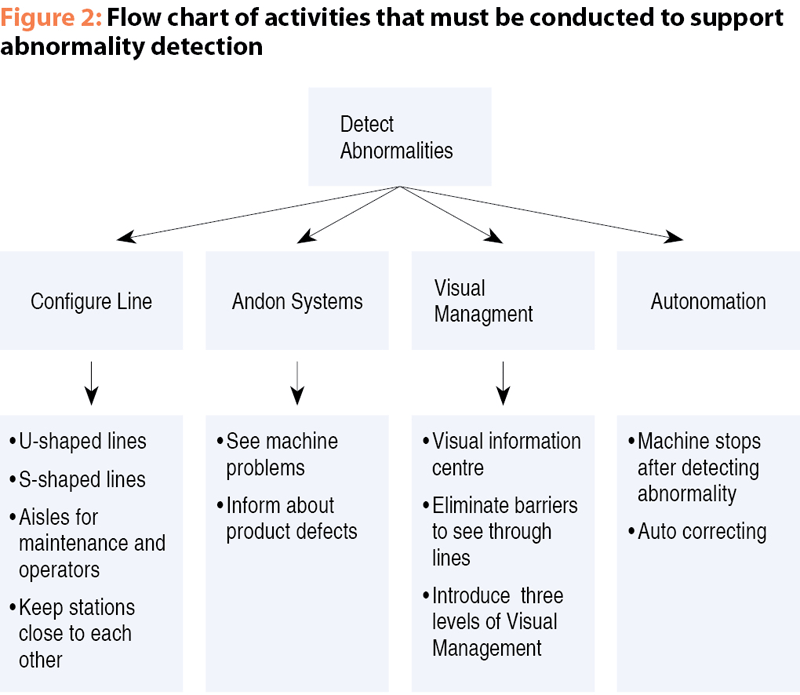
• Detecting abnormalities for continuous improvement.
Detecting an abnormality in time saves a lot of dollars in the long as well as the short run. Hence making problems visible is on the pillars of successful production management.
| Table 1: Seven factors to reduce waste during production: | |
| Waste | Factors to be considered for designing Lean process. |
| Transportation | Unnecessary storage spaces increase handling. Handling time also increases if carriers are too big. |
| Inventory | Overproduction, redundant buffers and risk-averse production tendency can cause inventory. |
| Motion | The workstation configuration, line layouts, conveyors, etc. cause too much strain (mental and physical) on operators. |
| Waiting | Line imbalance (in terms of cycle time between operators), batching tendency and long distances between processes. |
| Overproduction | Extra space between machines and departments invites overproduction. Performance management solely based on build to volume can increase occurrences of overproduction. |
| Over-processing | Conservative process design or machine tolerances and lackadaisical attitude to first time right cause over-processing. |
| Defects | Process non-standardization, poor process design, workstation layout and operator training. |
3. Identify the measurables at plant and department levels
Process measurables benchmark the success of the Lean process design. To identify the process measurables, relationship between elements of production and process design must be established. The following are the key measurables that support the objectives of a sound production system at plant-level:
a) Increase value add %.
b) Increase value add floor space %.
c) Reduce dock-to-dock time.
d) Reduce transfer distances.
e) Reduce inventory in the organization.
f) Reduce changeover time.
g) Improve FTT %.
Each measurable is described herewith:
a) Increase Value Add %
An activity that changes the fit, form and function of the product or a service is called Value Add. The Value Add %, is the percentage of the Value Add Time in the Total Process Time (or Throughput Time).
Value Add % = (Total Value Add Time/Total Process Time) x 100
b) Increase Value Add Floor Space %
Value Addition of a product must be supported by machines and operators who expand cycle time in mostly adding value to the product. To add value one needs workstations (if it is a labour-intensive operation) and machines.
Value Add Floor Space % = Percentage of Floor Space occupied by workstations or machines (equipment) relative to the entire plant.
c) Reduce Dock-to-Dock Time
Dock-to-Dock time measures the material flow in the value stream. It is the time taken for components or raw materials from the dock (receiving end) through production to shipment of finished goods from the shipping dock. It can also be looked at as the speed of conversion of raw materials into finished goods within the value stream.
As Dock-to-Dock time reduces, speed of flow also increases.
Dock-to-Dock Time = (Raw Materials + WIP + Finished Goods Stock)/(Sales During Week/Hours Per Week)
d) Reduce Transfer Distances
The material handling within the plant should be reduced as much as possible because it is largely non-value add activity. Therefore, the transfer distance (material conveyance distance) between workstations and department must be kept minimum.
e) Reduce Inventory in the Organization
WIP to SWIP report shows the inventory of the product in the plant. While SWIP is Standard Work in Progress, WIP is Work in Progress.
The purpose of tracking WIP to SWIP report is to:
• Determine the inventory balance on the production line.
• Measure the effectiveness of the pull system.
• Support workplace organization.
Assuming that end-to-end inventory is fixed at 2000 units and actual inventory is 2600, the WIP to SWIP Ratio is:
WIP to SWIP Ratio = 2600/2000 = 1.3 (slightly more inventory than planned). Ideally the WIP to SWIP Ratio must be 1.
| Table 1: Show the key measurables that support the objectives of the sound production system at department level | |||
| Elements | Metric | Review frequency | When |
| Safety | Accidents per day | Daily | Morning meeting |
| Near Miss | Daily | Morning meeting | |
| Quality | FTT % (First Time Through) | Daily | Morning meeting |
| Rejections | Every hour | Top of the hour | |
| Delivery | Jobs per hour | Every hour | Top of the hour |
| Volume per day | Daily | Morning meeting | |
| OEE % | Daily | Morning meeting | |
| WIP to SWIP ratio | Daily | Morning meeting | |
| Cost | Hours per unit | Weekly | Weekly meeting |
| Units per person | First Meeting | Morning meeting | |
| Morale | Absenteeism % | First Meeting | Morning meeting |
| Attrition % | Weekly | Morning meeting | |
| Environment | 5S audit score | Weekly | Morning meeting |
f) Reduce Changeover Time
Over the years, the buyers have replaced one product of larger batch sizes to various products of smaller lot sizes, it is imperative to reduce the changeover time in the production system between old and new products.
SMED (Single-Minute Exchange of Dies) is used to reduce changeover time. In the industry, the changeover time varies from 1-2 hours to 12 hours. This can be reduced to less than 10 minutes.
g) Improve FTT (First Time Through) %
FTT, expressed in terms of %, is measured to check whether the products are manufactured right first time.
The purpose of tracking FTT is to:
• Determine the ability of the unit to manufacture right first time.
• Expose the hidden factory (scrap, rework, and rejections).
• Measure the effectiveness of standardized work (non-varying cycle times).
• Focus on capability of the process.
Eg: Assuming that an apparel is produced simplistically in sequential operations like Cutting, Sewing and Finishing and the FTT for each of these departments is 90%, 90% and 90%, the FTT % for the entire production line would be 0.9 x 0.9 x 0.9 x 100 = 0.729 x 100 = 72.9 %.
Follow-up article on Lean Design and Strategy talks about manifesting the hypothesis into a plant-wide strategy and provides guidelines to execute the same.
It means that only 72.9% of the garments move through the production line without being reworked.
The first step establishes a firm hypothesis and a guiding vision to run the production floor. Not only does it firm-up the philosophy behind the running of the plant, it also provides tactical clues to manifest the vision.
Flow-centric view of production management is created by connecting the vision, guiding principles, principles translated into objectives and finally objectives giving way to measurables that define daily production tactics.