
In the field of operation research there are many interesting scientific theories which are also taught in several professional programmes in apparel production technology, which may bring substantial benefit to users. In the series on operation research application in apparel industry, SW April 2011, the concept of PERT/CPM were discussed in detail. Ideally PERT networks are prepared only for first time projects, to monitor regular ongoing projects Gantt charts are more helpful because when preparing Gantt charts it is assumed that time duration for each task is already available. As duration of tasks in apparel preproduction are generally known and scheduling them based on delivery date is the objective of TnA, Gantt charts are ideal tools for preparing and following up TnA calendar. Dr. Prabir Jana, Professor, NIFT, Delhi explains how Gantt charts can be used effectively for successful TnA management…
The most important challenge faced by merchandisers in manufacturing and sourcing organizations is making and following a time and action calendar. Time and action calendar (popularly known as TnA calendar) is considered a must for merchandisers to keep track of sequence of tasks leading to product delivery. How do we calculate when to approve the lab-dips in order to ensure cutting starts by planned cut date? How do we know one merchandiser can handle how many orders optimally? We may get or generate a ‘to-do list’ but how do we prioritise tasks to do in a day? How could a merchandiser or manager quickly know whether production was on schedule, ahead of schedule, or behind schedule? How to identify and rationalize leave sanction of employees to ensure minimum impact on performance or even prioritizing purchase of items for bottleneck tasks? Is there any scientific technique or just gut feeling and past experience the only solution…? The Gantt chart is an operation research tool designed to provide scientific solutions to all these queries.
How does Gantt chart work?
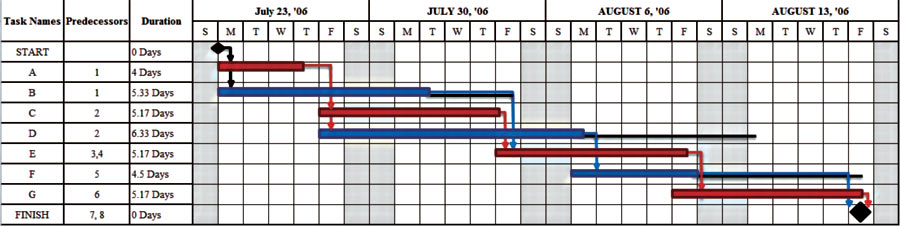
A Gantt chart is a type of horizontal bar chart that illustrates a project schedule right from the start to finish dates of the terminal elements and summary elements of a project. Like PERT chart, some Gantt charts also show the dependency relationships between tasks and critical path in different colours. In Figure 1, Gantt chart task B is the predecessor of task E and task A is predecessor of task C and D both. However tasks A and B can start simultaneously. Although task B is completed earlier than task C but task E can start only after completion of both tasks B and C, thus task B has slag time of approximately 3.5 days.
In a Gantt chart the length of horizontal bars indicate the duration of tasks and by shading part of the horizontal bars per cent completion of tasks as on date can be shown. In figure 1, the weekly time scale of year 2006 is shown with Sunday the opening day of each week and grey hashed line in Saturday and Sunday are marked as holiday.
The green colour vertical line shows end of 26th July 2006 and status of A and B task with hashed line. The red coloured arrows show the critical path and red coloured tasks are critical.
The width of the horizontal bars does not represent anything and since the horizontal bars have a fixed height, they sometimes misrepresent the time-phased workload (resource requirements) of an order, which may cause confusion especially in large volume orders. Still a Gantt chart is very useful and valuable for orders that fit on a single sheet or screen to convey only key information of the complex order execution in a simplistic manner.
Why in Apparel Pre-production?
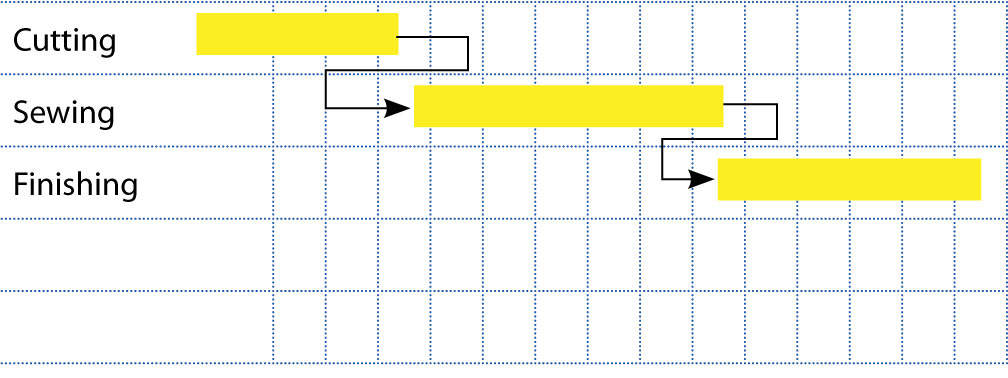
Although the Gantt chart is quite similar to PERT/CPM, it still has few advantages. In PERT network two tasks can be linked only by one type of relationship – finish-to-start relation, i.e. once previous task is completely finished then only next task can start. One such example is in sample making, which can start only after completion of pattern making. For example if cutting of total 5000 pieces of blouse takes 5 days and sewing of same takes 10 days and both are scheduled by finish-start relationship then completion of sewing will take 15 days from start of cutting, (see figure 2). However in reality sewing task can start within 1-2 days after commencement of cutting and then both can happen simultaneously. In Gantt chart, two tasks can be linked in three different relations: finish-to-start, start-to-start, and finish-to-finish. This feature of Gantt chart is great advantage over PERT when used in apparel manufacturing.
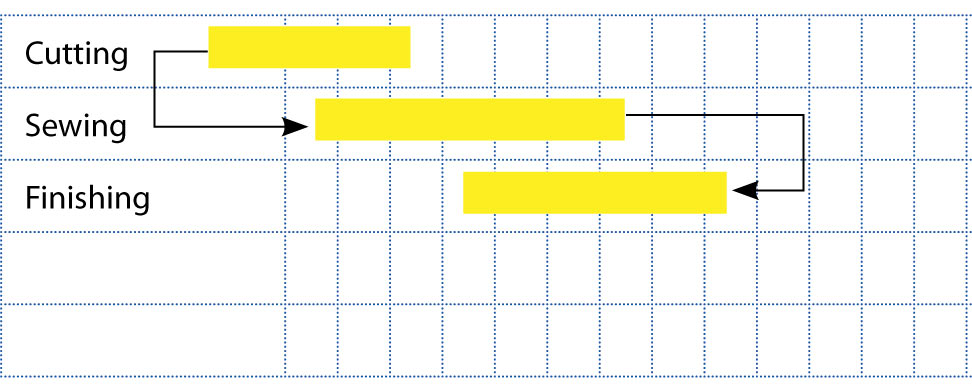
In above example cutting and sewing can be linked using start-start relation keeping two days lag between start of sewing from start of cutting. Now cutting and sewing both can be finished within 12 days using start-start relationship (see figure 3). Similarly when any succeeding task takes lesser time than preceding task, finish-finish relationship should be followed. In above example suppose finishing of 5000 pieces can be done in 7 days with one day of overhang, and then sewing and finishing can be done in 12 days with overlap of 5 days. These realistic ways of scheduling tasks in overlapping manner using start-start and finish-finish relationship is a very unique advantage of using Gantt chart for TnA calendar.
Implementing Gantt chart for TnA calendar
A typical starting task for any order is order receipt and end task may be defined as shipment leaving the factory. In-between the start and end task, there are numerous tasks that are interdependent. Once the dependencies between any two tasks are known, Gantt chart may be prepared by simply connecting the two tasks.
Although Gantt chart can be prepared manually, it is best prepared using computer programs. Once the number of tasks is more than 10 and has many diverging and converging interdependency, calculating slag time manually is very cumbersome and prone to error. Two characteristics of garment pre-production tasks like reverse scheduling and resource dependencies can be addressed very well using Gantt chart software.
Reverse scheduling means deciding the date of last task first and then scheduling the previous tasks chronologically backwards. Once the delivery date of the order and interdependence between different tasks are defined, Gantt chart can be drawn automatically through software. Also whenever duration of any task is changed or any dependency relation is changed, computerized Gantt chart can incorporate the changes automatically keeping other parameters intact. Computerized Gantt chart can indicate the critical path in red colour, show individual task earliest start date, latest start date automatically. Once the executives responsible for each task are defined, Gantt chart software can calculate resource (human) utilization across multiple orders that any one executive may be looking after. Once the particular order follow up is started, Gantt chart software can show the planned and actual dates of tasks and calculate delay analysis dynamically.
Another very common scenario in garment pre-production is multi order follow-up by single team of executives. Commonly, a separate TnA calendar is prepared for each order and the same team of people follows up each such order using separate to-do list generated by individual TnA. In absence of an integrated consolidated to-do list the executives attend individual tasks in order of convenience resulting in undue delay in some tasks. However, technically one single integrated TnA should be made for common resources (one team) for correct follow up. While multi order integration of manual TnA is impossible, combining multiple Gantt chart is very simple using software. The Gantt chart automatically schedule the tasks for each executive, calculates the combined workload of tasks for each executive, automatically levelling the workload if possible to ease out the overload.
Keeping in mind that all garment industry merchandisers and planners are not necessarily engineers who are trained in operation research concepts, Gantt chart may be the most appropriate, easy to use tool for scientifically making/monitoring any TnA calendar and simplistically displaying the status. However, Gantt charts do not represent the size of a project or the relative size of work elements, therefore the magnitude of a behind-schedule condition is easily miscommunicated. If two orders are the same number of days behind schedule, the larger volume order has a larger impact on resource utilization of the factory, yet the Gantt does not represent this difference.