Garment pre-production (also known as merchandising) activities are characterized by people-oriented functions. Numerous interdependent activities are synchronized between succeeding and preceding activities to make a non-linear process network. It is common practice to use critical path logic in apparel pre-production activities, to set important milestones of activities with the ultimate goal of delivering an order within the original delivery date. This practice is also known as Time and Action (TNA) Calendar. In our StitchWorld April 2009 issue, Prof.
Prabir Jana from NIFT, Delhi; Dr. Alistair Knox, from Nottingham Trent University, UK; and Prof. A.S. Narag, from Faculty of Management Studies, Delhi discussed the shortcomings of making a single order TNA and the limitations of using a spreadsheet for TNA follow up. In this article, they discuss how to make a multi-order combined TNA for a common set of executives to follow up on orders in the best possible way.
Despite claims by almost every buying and manufacturing organization that it uses efficiency-enhancing and aim-specific software, close scrutiny often reveals that its TNA Calendar is far from satisfactory and missed deadlines and last minute surprises remain a common feature. In order to understand this innate drawback, it becomes imperative to examine the rationale behind it and consequently, derive a possible solution.
The commonly used spreadsheet-based software for TNA follow-up merely records the data, acting, in effect, as an electronic register. All organizations use spread-sheets instead of handwritten charts because it is easier to update records as and when changes take place. However, the software should not only record data but also analyze it, raise an alarm if so required and enable the user to postulate several ‘what-if’ scenarios.
Making a TNA Calendar is not just entering activity names and duration in tabular forms, it is also about scientifically working-out the activity duration, logically determining the preceding and succeeding activities and then depicting the critical path. Spreadsheets cannot do any of these, while any Critical Path Method (CPM) or Gantt chart software can. A Gantt chart is a horizontal bar chart depicted against a running calendar developed as a production control tool in 1917 by Henry L. Gantt, an American engineer and social scientist. Bars represent different activities and are linked based on dependency (i.e. precedence network) relationships. The Critical Path is then depicted in a different colour.
Basic Software Functionalities to Handle Multi-order TNA
The project management software tool is ideal only when it enables the creation of a Gantt chart and CPM. Though several apparel industry specific ERP and PLM software offer Gantt chart and CPM functionality, it is important that the requirements of the user are understood and complied with.
The software should be able to present CPM in different colours to distinguish and bestow special attention to critical activities as against other activities. Any delay in critical activities will result in overall delivery delay and possibly, an insignificant delay in other (non-critical) activities.
Subproject Features
Often different colours are ordered for one style; while tasks like ‘fit sample approval’ and ‘size set’ are common, lab dip, fabric source, cut, make and finish are separate for every colour. These separate processes in a main project or master project are called subprojects or representative task. The elements of the subproject present in the master project are its duration, percentage work completed, and an optional selection of resource assignment information.
Consider the example of lab dip approval where one order or style has many tasks or activities. At the master level, it can be considered as one activity. However, at the subproject level it can be further broken down to activities like fabric sample dispatch for dyeing; in-house colour matching; sending the sample to the buyer for approval; receipt of sample approval from the buyer, etc. Subproject offers micro activity breakdown, separate tracking of activity and the user can switch between different views.
Calendar, Resource and Buffers: The software should be able to create and apply calendars (assign time and date to a project), define key resources (people assigned to the job, also called drum resources), split tasks, level resource over allocations, insert capacity buffers to protect project due dates from creating cross-project conflicts on drum (key) resources while also prioritizing the task.
Start/End Lag Time Scheduling and Optimizing: Another feature that helps in scheduling and optimizing the buffers is start/end lag times. Start lag times allow the succeeding task to be scheduled earlier than what the preceding task would normally allow, while end lag times force the succeeding task to be scheduled later than the predecessor would normally allow. In other words, if a task of two days is to be completed in a given time of three days, then there is a choice of working on the first two days and relaxing on the third day (lead time) or, taking a break on day one (lag time) and then completing the task on the second and third day. To make certain that the job is done at the right time, start lag times are generally given to a task. However, it might not be always appropriate as it gives rise to a higher inventory, leading to high inventory carrying cost.
Making a TNA Calendar is not just entering activity names and duration in tabular forms, it is also about scientifically working out the activity duration, logically determining the preceding and succeeding activities and then depicting the critical path
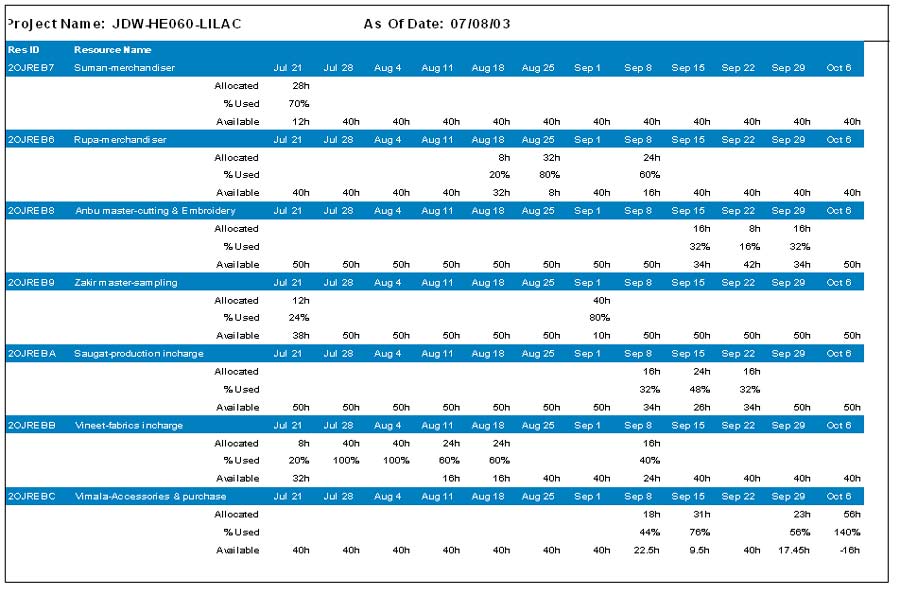
Resources Planning: Once work content of a task and available resources are measurably defined and linked with activities in the network, the software should be capable of calculating resource utilization, indicate availability of free resources and raise an alarm for overutilization of resources.
Multi-order Gantt Chart: The software should be able to combine/integrate more than two Gantt charts to reflect the resource constraint automatically. This is the single most important functionality which maintains priority of an order, keeping in mind resource availability during multiple order planning.
Dynamic Update: To handle multiple Gantt charts, the software should be able to change plans, i.e. change dates during progress of the order. It should show the planned and actual dates of activities; calculate deviation, if any, and raise an alarm by a change in colour or by sending an automatic e-mail.
Task Relationships: Different options of task relationships are Finish-Start (FS), Start-Start (SS), or Finish-Finish (FF), which assist in deciding when to start an activity. In software, one task can be linked to another by visually connecting them in a Gantt chart, showing whether they have a FS, SS, or FF relationship. Typically all softwares have only an FS relationship, which means succeeding activity can start only after completion of the preceding activity.
Sample making activity can only start after pattern making is fully complete; thus pattern making and sample making activity follows FS relationship. A majority of the pre-production and approval related activities are of this type.
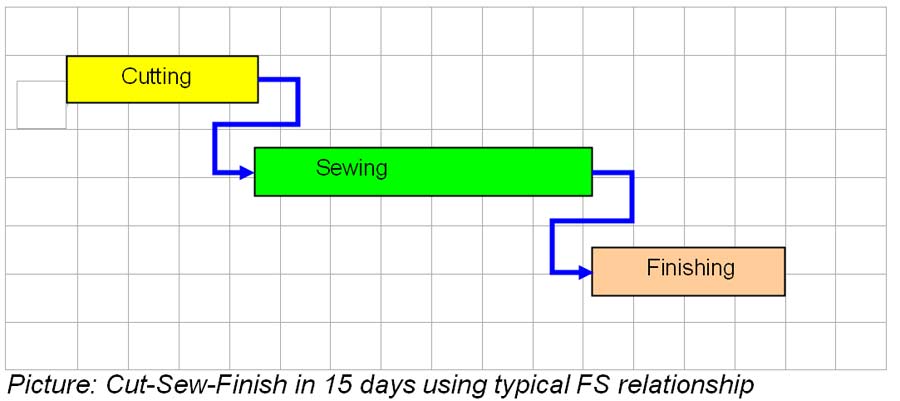
Nevertheless, both SS and FF are equally important in the apparel business as the links between cutting, sewing, finishing activities are generally governed by these types of relationships. For example, an order of 2,000 pieces takes 4 days to cut, 7 days to sew and 4 days to finish. If we schedule these three activities using a typical FS relationship, then cut to finish will take 15 days.
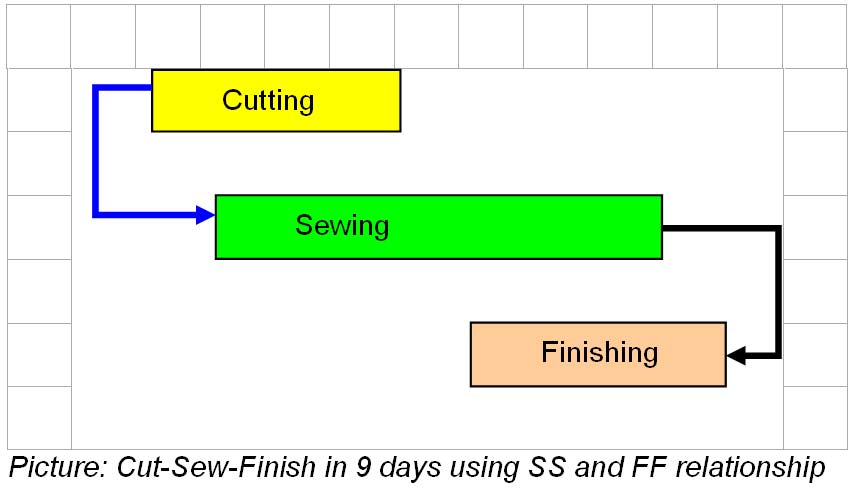
Realistically, sewing should not wait for 4 days (till all pieces are cut) and can start after cutting of the first lot is over. Say sewing can start after first day of cutting, so cutting and sewing can follow an SS relationship with a one day lag in-between. Similarly, finishing also can start after the first day of sewing, but as finishing takes a total of 4 days compared to 7 in sewing, so sewing to finishing has to follow an FF relationship, with a one day lag in-between. That means finishing can be completed one day after completion of sewing. So, cut to sew can be completed in a total of 9 days.
Multi-project capabilities of the software helps to merge individual TNA Calendars into a master TNA Calendar and view all schedule and resource information together as though it is one project. Grouping of schedule and resource information in the apparel business helps to maintain separate order files for different orders of a group while still being able to define dependencies of resources between the orders.
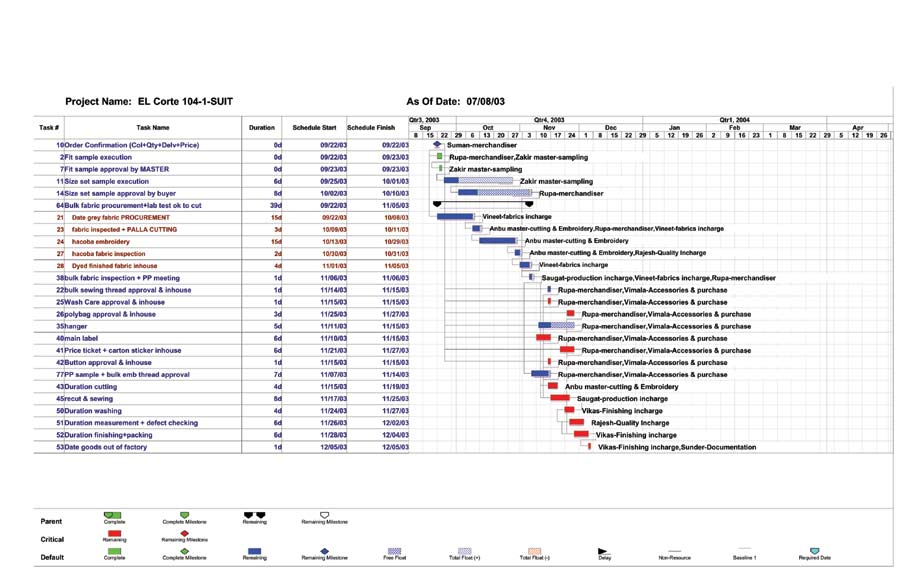
TNA Calendar Implementation using Specialized Software
The first step is to define resources (i.e. the people available for actually doing the task, like merchandiser, master, supervisor, sampling operator, quality controller, purchase officer, etc.) from the Resource List. Next, resources are assigned to the tasks. A master is assigned to sample making, a purchase officer to fabric sourcing, a merchandiser to techpack making, etc. During assigning of resources, certain parameters like the nature of the task, how much time the task is going to take with a specific number of resources assigned are also taken into consideration.
Distinctions are made between elapsed time and effort time while estimating task durations. Elapsed time is the actual amount of time between the start and finish of the task, whereas the effort time is the amount of time that a resource actually spends working on a task. This concept is particularly useful in activities like “lab dip sent to buyer” or “grey fabric ordered” which have one day as task duration, which is basically elapsed time. Actual effort time, however, would not be more than 30 minutes inclusive of all micro activities. While estimating effort time, the complexity of the task, the proficiency of available resources and the efficiency of the resource over the time are taken into consideration.
Resource Sensitivity is another factor to consider before assigning resources to tasks. Resource sensitivity defines how the number of resources applied to a task affects the duration of the task. Resource sensitive task will decrease in duration as the number of resources increase. If one labourer is assigned at labour resource to the task of inspecting 100 samples, it may take X units of time, but when two labour resources are assigned (assuming they are both equally efficient using the equipment and process), the duration of the task is reduced by half. On the other hand, resource insensitive task is generally unaffected by the number of resources applied to it. For instance, consider the making of a pattern of a style or sewing a sample. When one master or tailor is assigned to the task, it takes a certain amount of time for completing all patterns of the style from sewing to finish. By assigning an additional master or tailor to the task, the pattern or the sample will not be made/sewn any faster.
This is due to the long cycle time of the task, for e.g. pattern making for a style takes one pattern master 45 minutes, but allocating two pattern masters will not cut the time by half as the task cannot be shared by the two. Two pattern masters may make patterns for two styles in 45 minutes, but the duration will remain 45 minutes. Resource independent tasks are those which are to be done by a third party, like dyeing of fabric (in a fabric processing unit), fit sample approval by buyer (at the buyer’s office), fabric colourfastness testing (at the testing house), etc. These activities do not require resource time. However a resource is assigned to do the follow-up job.