
Global macro-economic indicators, competition and cost pressures are compelling organizations to focus on “Operational Excellence”. Successful manufacturers excel in operations through the use of principles like Value Stream Mapping and other tools under the aegis of Toyota Production System, which advocate waste elimination from manufacturing processes, resulting in enhanced efficiency and quality.
Current scenario at apparel manufacturing shopfloor
Apparel manufacturing involves raw material (fabric) cutting, sewing, finishing and finished goods storage. If we summarize typical issues that surface in the factories today, the list would be something like this:
• Piles of pieces waiting to be reworked.
• Lot of delays due to larger lots.
• No standard WIP (Work in Progress) maintained on the floor.
• Stocks misplaced in stores and shopfloor.
• Overproduction (goods made too early or excess of what is required).
• High retrieval time experienced in raw material and finished goods stores.
• High turnaround time (order placement to payment cycle is long).
• Seven types of wastes seen in all departments.
• Poor first time through per cent (FTT%).
• Process delays due to lack of synchronization between preparatory sections.
• Lack of uniform understanding of what constitutes a good product.
• Capacity constraints induced by skill variability and individual variability.
• Longer set-up times between product changeovers.
• Challenges of multi-skilling.
• Machine breakdowns/repair delay.
Anand Deshpande, Founder & CEO, Admaa Consulting, illustrates how Value Stream Mapping, one such tool for attaining Operational Excellence, can be used to eliminate excess inventory and build efficient systems.

These issues can be addressed by implementing Lean in a very systematic and coherent manner. One basic tool that can be used and which I am afraid many garment factories fail to implement is Value Stream Mapping (VSM). It is a very powerful tool used to identify waste in the entire value stream, defined as a set of activities required to convert raw materials into finished goods. A simple Material and Information Flow Analysis Diagram traces the path of production and identifies key waste elimination opportunities. Managing inventory across the path of production can also address the first five issues highlighted above.
Using the Value Stream Map also helps us understand the impact of reducing inventory on the organization. We shall discuss briefly the rationale behind every inventory-reduction action point…
Value Stream Mapping
The steps used in Value Stream Mapping are:
• Identify the product family.
• Draw the current state map.
• Draw the desired state map.
• Identify projects and chalk out a project plan to eliminate waste.
In this case study, we will draw a current state VSM for a typical jacket product family with the daily customer demand of 500 pieces and shipment occurring once a week. The factory works for 6 days in a week and one container ships 3,000 pieces. Daily working hours are 8 hours (480 minutes) excluding lunch and tea breaks.
Before we analyse the current state Value Stream Map, we compute the ‘Takt Time’ wherein:
Takt Time = (Available time in minutes per day)/daily customer demand
= 480 mins/500 pcs = 0.96 mins = 57.6 secs
We complete the VSM by computing the overall value add time, production lead time and also identifying waste and bottleneck operations.
The current state VSM as shown in Figure A generates some interesting insights:
• The production lead time from the beginning of the store to the shipping of the container for one lot of 500 jackets is 58 days.
• The activities are categorized into Value Add (VA), Essential Non Value Add (ENVA), and Non Value Add (NVA) activities. The Value Add Time was found as only 116.3 minutes, this is only 0.41% of total time (58 days x 8 hours x 480 minutes).
• The reason for longer lead time is due to the Work in Progress between sections, within sections and inventory in raw material (fabric stores) and finished goods.
• There is no capacity constraint as the Cycle Time is lower than the Takt Time in all sections.
• Four shipments are effected in a month.
• Machine reliability is only 90% in the sewing final assembly section.
• Inventory in the fabric stores is very high: one month (26 days).
• In sewing and cutting, the alteration (rejection) rate is very high.
• The changeover time is high in sewing: 3 hours.

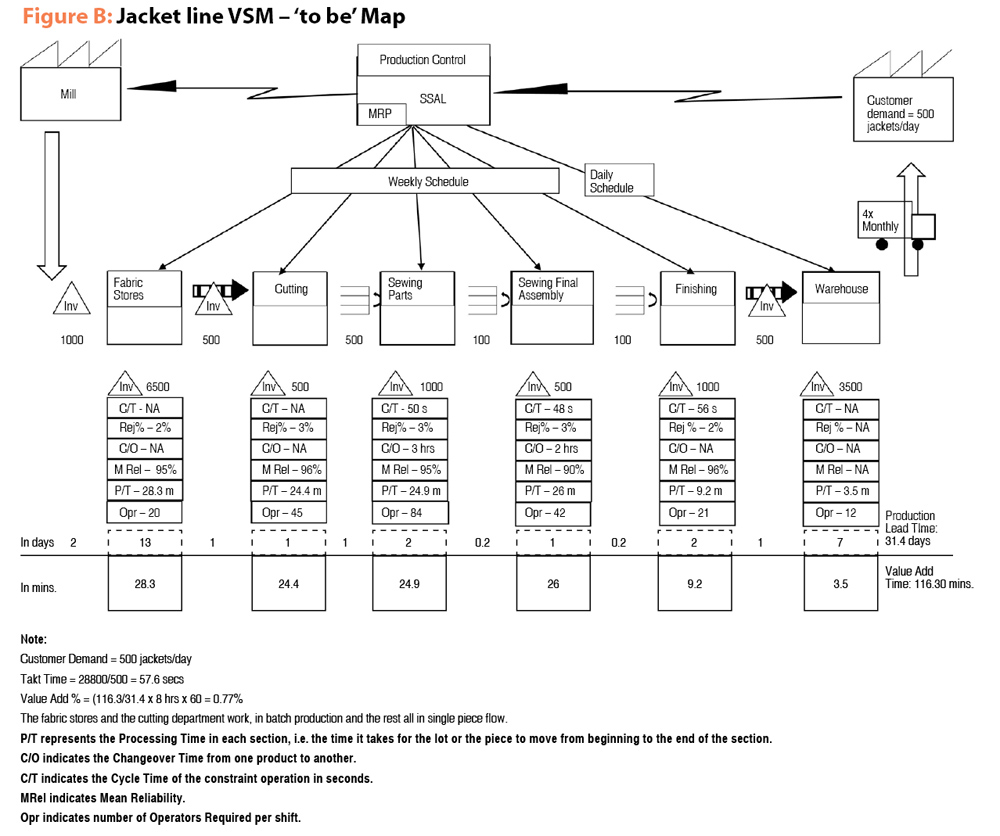
The management organizes a brainstorming session to create a Future State Value Stream Map as shown in Figure B. They take a decision to improve delivery times on an immediate basis by rationalizing the WIP and reducing inventory across the entire path of production. Kaizen bursts with cross-functional teams organized on themes like:
1. Improving supply chain efficiency.
2. Creating supermarkets between major departments or wherever a handoff takes place and installs a pull system.
3. Define standard WIP between departments.
The Future State VSM as shown in Figure B throws some interesting observations:
1. Production lead time has reduced from 58 days to 31.4 days only by reducing the inventory between and within the departments.
2. The inventory within departments has been reduced from 41 days to 26 days by proposing strategies as summarized Table 1.
3. The inventory between departments has been reduced from 17 days to 5.4 days by proposing strategies as summarized in Table 2.
VA – Activity that brings about change in the fit, form and function of a product; for example, in cutting – VA could mean actual cutting by the cutter.
ENVA – Activity that does not add any value, but is currently required by the system; for example, in cutting – ENVA is the dry haul of the cutting machine.
NVA – Activity that does not add any value at all – like unnecessary transportation.

The overall benefits of reducing inventory in the case study are:
• Reduction of production lead time from 58 days to 31.4 days (an improvement of 46%).
• Improvement in Value Add (VA) Time from 0.41% to 0.77% (an improvement of 92.5%).
• Reduced NVA by reducing the stock by 26.6 days.
• Faster response to problems as there is no inventory to fall back upon (like reducing mean time to repair a machine).
• Reduction in quality issues.
• Better visual management as there is no confusion in locations of WIP on the floor for any order.
• Utilizing capacity only to produce orders that are to be shipped and not producing orders that are required far into the future.
• Reduced overproduction (reducing goods that are produced too early and those that are not required).