In the present business environment there is a huge demand for real time information which is the right information at the right time for strategic decision making at many levels of the business. The need for real-time information is even more intense in the production world where monitoring is key to maintaining supply chain transparency and drawing the best out of verticality of supply chain. Moreover, real-time production monitoring is geared to driving towards the ultimate goal of on time delivery of a quality product and enhance shop floor performance.

Sabre Technologies which is a wholly owned subsidiary of Mas Holdings, Sri Lanka has come up with its latest technological marvel called RAPTOR which is a RFID (Radio Frequency Identification) aided real-time production monitoring tool which helps track items flowing through the manufacturing supply chain.
Amila Nandasekera, a senior implementation consultant with Sabre Technologies, implemented the pilot project at Linea Intimo shop floor, an activewear manufacturing plant of Mas Holdings and shares the important findings of the pilot run.
The total cost of implementation of the project of a 500-operator factory is approximately US $ 50,000 which includes hardware, software and training, keeping in mind that it may vary depending on customer requirement. Ideally the ROI is less than 12 months
Introduction To Technology
The technology used is a RFID (Radio Frequency Identification) aided effective production monitoring tool (RAPTOR) which helps count and track items flowing through the main segments of the supply chain, upstream, mid-stream and downstream. Moreover, among RAPTOR’s unique capabilities is its ability to provide real-time information that as and when manufacturing happens all the manufacturing Key Performance Indicators (KPI’s) and other manufacturing related information can be retrieved by whoever user/authorized to access such information regardless of where they are physically based.
It helps manage by objectives which are facilitated by sending alerts to relevant process owners and strategic decision makers whenever a KPI is below its entitlement thereby helping get the KPI back on an even keel before it’s too late.
It serves as an organization-wide decision support system which play host to a lot of useful information which can be further processed or used as is to make important strategic decisions which could impact the organization both in the short-term and long-term. Moreover RAPTOR also plays the role of a Business Intelligence (BI) tool where RAPTOR drills down to where the root cause of the problem exactly lies.
It plays a pivotally important role in driving the shop floor towards a lean one which contributes to maximize flow and eliminate waste on the shop floor. To this effect RAPTOR can eliminate the wastes of waiting through multi-unit coordination, waste of transportation through electronic transfer of data and waste of overproduction through real-time WIP information.
Moreover, RAPTOR helps manage workstation-wise WIP which leads to lean manufacturing. Aside from RAPTOR’s role as a lean tool it also helps six-sigma way of management by capturing process defects, defectives and First Time Right (FTR) to eliminate defects and strive for perfection in quality. Therefore, on the whole, RAPTOR helps reap benefits of both lean and six sigma where they converge together to maximize the rolled throughput yield of the process. All the more so, RAPTOR is designed to run in conjunction with any ERP (Enterprise Resource Planning) system while complementing the ERP adding value to it.
Last but certainly not the least, RAPTOR is a quintessential production monitoring tool which is a tool worth investing on for the potential customers, precisely because it empowers the users to catch issues in production a lot faster and access right information at the right time to make the right decision to sustain production KPI’s to better respond to the voice of the customer and all of these coming at a lot less cost which can be recovered in less than a year.
During the course of the pilot production managers, production executives, operator girls, supervisors and the senior management of Linea Intimo (Sri Lanka) claimed that RAPTOR’s ability to provide real-time information helps make right decisions at the right time with right-information
How The Pilot Run Was Done
The pilot was organized to track sewing operation at line-in where the bundles are fed into the line, at line-out where finished goods are inspected 100% for quality each of which points had a RFID reader of its own. Apart from the above two main RFID readers, there was another RFID reader just after the line-out RFID reader to reallocate RFID tags. In addition to the RFID readers, a display board was hung-up at line-out to indicate real-time efficiency, target for the shift, cumulative actual output and cumulative defective percentage while there were alerts on the display board for open down time, lost time, over-production, underproduction, work-in-progress, garment rejects, panel rejects and absenteeism to help supervisors and operator girls know in real-time whether or not the above production KPI’s are within tolerance while the production was going on.
The pilot project using four different RFID tags (Operator tags, Bundle tags, Down time tags, and Mechanic tags) was organised to measure important KPI’s.
Right at the start, an RFID tag was given to each of the operator of the factory working with the PBU system, which they had to tag themselves on the line-in reader before starting sewing. After all the operator girls tagged themselves in, the operator girl at the line-in fed the bundles into the production line and scanned the respective bundle tags on the line-in RFID reader to indicate WIP (Work in Progress) within the line.
As soon as the finished garments came to the line-out operator, several defects were noticed, and the girl there entered the number of defects and number of defectives in the line-out reader and tagged out only the passable garments while the failed garments, other than rejects, were sent back to re-work. Once the re-worked garments were received back at the line-out, the operator girl there once again tagged them out. As and when the garments were tagged out on line-out RFID reader, the cumulative actual output was indicated on the display board while cumulative defective percentage was displayed on the display board every time the number of defectives were entered in the line-out reader.
Up to this point, only two readers were used. Whenever a new bundle is fed into the line, a bundle tag carrying information for that particular bundle was tagged on the line-in reader and whenever garments are out from the line, out quantity will be transferred from line-in reader to line-out reader and the tag will be tagged on the line-out reader to finish that particular transaction. This process happens every time the garments are out from the line.
In the pilot only line-in and line-out was tracked to give real-time WIP within the line because it was the customer requirement but the option also exists to track operator-wise WIP and in that case RFID reader has to be installed at each work station.

Every operator was given a tag each to capture daily shift-wise operator absenteeism details. The operators had just to scan their individual tags on the line-in reader to indicate that they have come to the production line to work which helps calculate an important KPI of absenteeism. When the girls finish work they have to again tag out on the line-in reader. This helps calculate individual worked minutes to calculate daily incentive for the operators. Even individual efficiency is based on the worked minutes calculated by every operator tagging in and out with operator tags.
Whenever, machines break down and work stops line supervisor had to scan the down-time tag on either line-in or line-out reader to indicate that the machine was down. The moment the downtime tag was scanned, the mechanic was sent an e-mail alert to trigger him to come to the line as soon as possible and get the machine working back. Once the mechanic came to the line, he scanned his tag on any of the two readers and started mending the machine. Once the machine was mended, the mechanic tagged himself out and the supervisor scanned the down-time tag back to confirm that machine was back, up and running. At the end of every shift, operator girls tagged themselves out on the line-in reader by scanning the operator tags given to them.
During the pilot e-mail alerts on, following KPI’s were sent to the production team and management team on an hourly basis –
- Planned shift efficiency vs. actual cumulative efficiency
- Target cumulative output vs. actual cumulative output
- Planned lost time vs. actual lost time
- Planned defective pieces vs. actual defective pieces
- Planned defective percentage vs. actual defective percentage
Conclusions on the Pilot Run
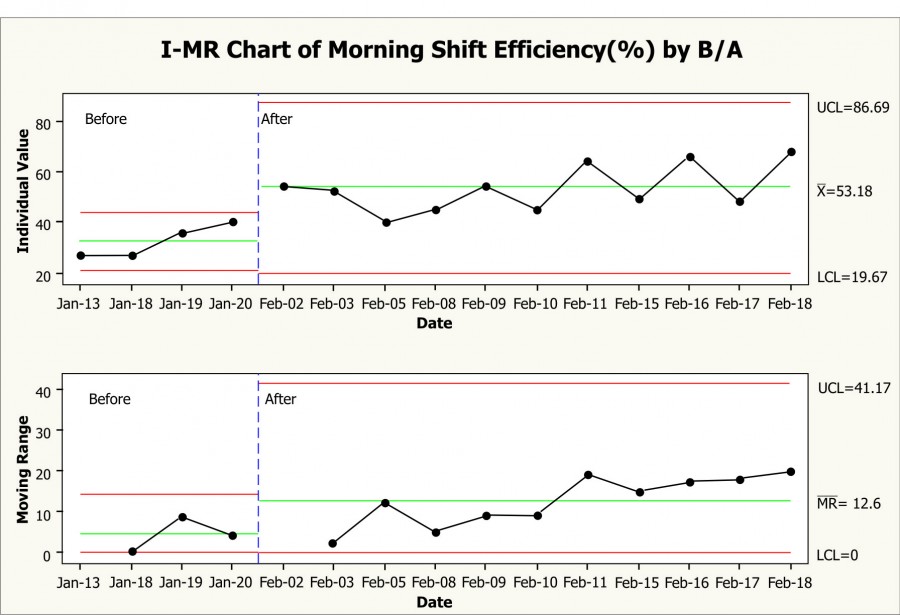
- RAPTOR increased sewing efficiency from 54% to 68% during the course of the pilot at Intimo while efficiency was on an upward trend during the pilot. All the more so, efficiency figures were higher during the pilot than before pilot. The mean efficiency during the pilot was 53.18% while it was 32.26% before pilot.
- According to the hypothesis test also, it can be statistically concluded that during-pilot efficiency was greater than before-pilot efficiency. So it can be concluded that RAPTOR has increased sewing efficiency during the pilot compared to before pilot. This improvement was due to display of real-time efficiency on the display board as and when finished garments come out from the line and e-mail alerts sent across to the production team and management team on real-time efficiency every half an hour. The real-time efficiency helped production team act pro-actively, catch issues faster and eliminate the barriers to increasing efficiency thereby increasing efficiency.
- RAPTOR decreased the proportion of defective garments from 5.26% to 0% during the course of the pilot. All the more so proportion of defective garments was on a downward trend during the course of the pilot. Furthermore, mean of proportion of defective garments during the pilot was 2.45% while it was 5.26% before pilot. This was all possible only because real-time defective garment percentage was recorded on the display board during the pilot unlike before when there was no real-time information available on garment fallout to the operator girls and the supervisors. The increase in quality level during the pilot was again attributed to the fact that during the pilot, an e-mail alert was sent to the production managers on cumulative target defective garment percentage vs. cumulative actual defective garment percentage every half an hour so that production managers could motivate operator girls through production executives and line-supervisors to do better on quality every time it drops. Another reason why the quality level went up during the pilot was that since real-time information was available on garment fallout supervisors, production managers and production executives could find the possible reasons for declining quality a lot faster than in a setup with no real-time information available on garment fallout. Because the issues with poor quality were found a lot faster, supervisors solved those issues a lot faster and minimized defective garment percentage as soon as possible without waiting too long as opposed to before pilot.
- Apart from efficiency and defective garment percentage, real-time reports were generated on machine downtime, operator absenteeism, defect percentage by defect type, operator incentive, actual output vs. target, First Time Right (FTR), real-time WIP and lost time. All the above reports were pulled through INFORMER which is RAPTOR’s reporting module.
It can be concluded that RAPTOR can benefit Intimo in the following major ways:
i) Reduce time spent on excel calculations and entering data into excel charts.
ii) Reduce headcount by removing data entry operators and recorders.
iii) Less use of excel charts on the shop floor due to availability of real-time reports thereby driving towards a paperless office.
- It can also be concluded that RAPTOR helped maintain WIP at a minimum level during the pilot because of the real-time WIP information provided frequently. This helped maximize flow of garments and eliminate waste during the pilot. RAPTOR encouraged lean manufacturing
during the pilot run.
- Moreover, RAPTOR helped minimize number of defective garments by giving real-time information on defective garment percentage during the pilot.
- RAPTOR increased Rolled Throughput Yield (RTY) during the pilot by encouraging lean manufacturing and minimizing defects.
- Last but not the least, e-mail alerts were sent on the following to the production team and management team daily every half an hour during the pilot.
i) Planned shift efficiency vs. actual cumulative efficiency.
ii) Target cumulative output vs. actual cumulative output.
iii) Planned lost time vs. actual lost time.
iv) Planned defective pieces vs. actual defective pieces.
v) Planned defective percentage vs. actual defective percentage.
- During the course of the pilot production managers, production executives, operator girls, supervisors and the senior management of Linea Intimo (Sri Lanka) claimed that RAPTOR’s ability to provide real-time information helps make right decisions at the right time with right-information.
Analysis And Discussion Of Pilot Data
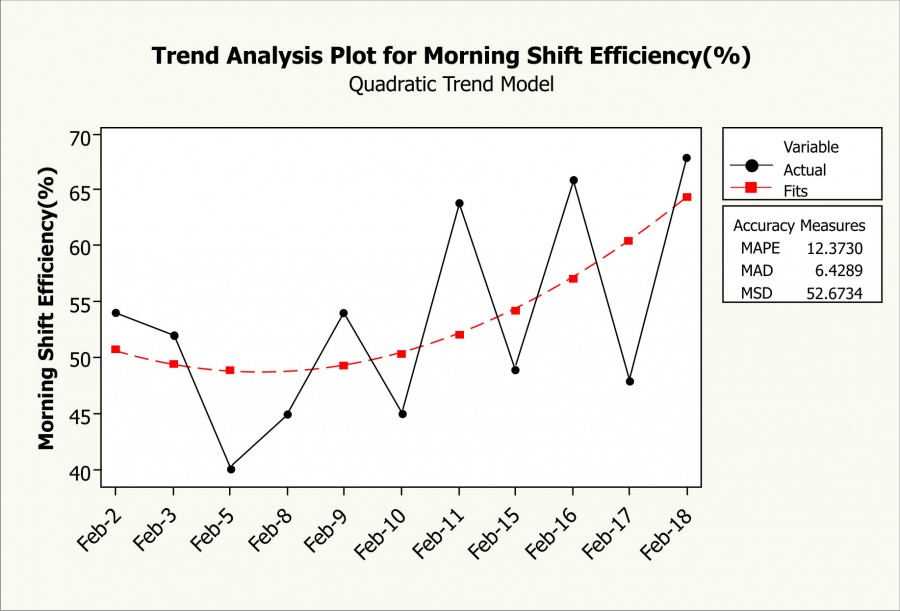
On the completion of the pilot, reports were analyzedusing statistical software. The statistical indicators used in the analysis are MAPE (Mean Absolute Percentage Error), MAD (Mean Absolute Deviation) and MSD (Mean Squared Deviation).
MAPE, MAD and MSD are three statistical measures which helps determine the accuracy of the fitted trend line. For all three measures, the smaller the value, the better the fit of the trend line. When the trend lines were being fitted to efficiency data and fall out data, out of all the possible trend models, only quadratic trend model returned the lowest values for MAPE, MAD and MSD and which was later chosen as quadratic model to explain the trend of efficiency and garment fall out.
An I-MR chart is an Individuals chart and Moving Range chart in the same graph window. Seeing both charts together allows one to track both the process level and the process variation at the same time, as well as detect the presence of special causes. Special causes are what cause unusual variations in the process.
According to the trend analysis plot (Chart 1) for morning shift sewing efficiency, it can be stated that the efficiency had been on an upward trend since the pilot kicked off on February 02, 2010 and during the pilot there recorded the highest efficiency of 68% on February 18, 2010 which was the last date of the pilot starting from a figure of 54%. The reason why the efficiency had been increasing during the course of the pilot was that the display board used for pilot displayed real-time efficiency as and when the finished garments came out from the production line. The operator girls could see the real-time efficiency on the display board and motivated themselves to do better on efficiency.
During the pilot line, the supervisor motivated the operator girls through the display board to keep increasing efficiency during the shift. This was all possible only because real-time efficiency was recorded on the display board unlike before when there was no real-time efficiency information available to the operator girls and the supervisors. The increase in efficiency was again attributed to the fact that during the pilot, an e-mail alert was sent to production managers on cumulative target efficiency vs. cumulative actual efficiency every half an hour so that production managers could motivate operator girls through production executives and line-supervisors to do better on efficiency every time it drops. Another reason why the efficiency went up during the pilot was that since real-time efficiency information was available supervisors, production managers and production executives could find the possible reasons for declining efficiency a lot faster.
The Chart 2 compares during pilot sewing efficiency with before-pilot sewing efficiency. According to the above control chart, during-pilot efficiency figures had been higher than before pilot where mean efficiency during the pilot was 53.18% while the mean efficiency before pilot was 32.26%. This was all possible only because real-time efficiency was recorded on the display board during the pilot. The increase in efficiency during the pilot was again attributed to the fact that during the pilot an e-mail alert was sent to production managers on cumulative target efficiency vs. cumulative actual efficiency every half an hour so that production managers could motivate operator girls to do better on efficiency every time it drops. Another reason why the efficiency went up during the pilot was that since real-time efficiency information was available supervisors, production managers and production executives could find the possible reasons for declining efficiency a lot faster. Because the issues with efficiency were found a lot faster, supervisors solved those issues a lot faster and soon got efficiency on an even keel.