Are you thinking about quality improvement? Well, if you are, great! If not, you should be, because a business that is not improving is essentially stagnating. Quality is not about defect reduction anymore, it is mainly about value enhancement and value enhancement comes from continuous improvement.
Successful companies are known to use continuous improvement to drive value and quality improvement is believed to be one of the least expensive ways to improve Return on Investment (ROI).
Quality improvement can be approached in one of the following two methods:
1. When there are known faults in your products, reduce or eliminate things that are wrong with them. For example, reducing defective percentage from 10.0 to 5.0%.
2. When there are apparently no quality problems, yet you wish to improve quality to reach the next level of performance, e.g., from 2.5% defective where everyone is happy to 1.5% defective, for competitive reasons. This is like going from ‘good’ to ‘great’.
Data Collection and Analysis

Data and information can come from various sources such as customer complaints, market research or information about how competition is doing, internal quality audits, internal inspection results, inspection results from the customers, etc.
It is very important to have quantitative knowledge about the nature of the problem or defects, i.e., the number of defects, at which point in a given process they occur, etc., before starting quality improvement efforts. This stems from data collection and analyses.
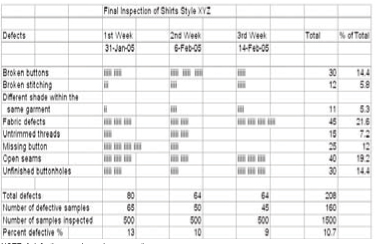
The best place to collect data is at the end of the line where the fully assembled and finished garment comes out. A check sheet is an effective tool to collect such data. The most straightforward way to use a check sheet is simply to make a list of defects that you expect will appear in a garment and make a tick mark beside each defect when it appears. Figure 1 is an example of such a check list. Each mark in the check sheet indicates a defect. The type, number and distribution of defects can be seen at a glance, which makes analysis of data quick and simple, from which conclusions can be drawn easily to first address those defects which occur more frequently.
Role of Management and Workers
Quality problems are generally a combination of both management and worker caused. It is important to differentiate between the two by analysing data collected for quality improvement.
Management controllable quality problems are related to policies, inter-departmental coordination, product and process designs, supplier selection, supplier relations practices, human resource policies, pay scales, etc. For example, all fabric defects in the above example are management, not worker controllable and should have been caught by the fabric inspectors. However, they would have at best caught or ‘identified’ fabric defects, without preventing them from happening. Only the management can deal with the fabric suppliers and get them to improve fabric quality. If that is not possible, only the management can decide to switch to better fabric suppliers.
When quality problems are management controllable, no amount of motivation or training of workers will help. Fabric defects will not go down or away just because the workers are highly motivated. A cutter will be able to cut away fabric defects if they are marked properly; however, it is still going to cost apparel manufacturers because of fabric wastage!
When quality problems are worker related, they can be divided into three areas (Stephens, 2004):
a. Willful errors – The worker is deliberately failing to comply for reasons good enough for him.
b. Lack of skill – The worker is unintentionally failing to comply; he isn’t skillful enough.
c. Inadvertence – Not only is the error unintentional, but the worker is also unaware he has made an error. These errors cannot be prevented by motivation but by making such operations failsafe.
[bleft]There is no ‘magic bullet’ that works for everyone or ‘one size fits all’ approach to quality improvement. Each organisation must find its own way to quality improvement[/bleft]
Assess what causes workmanship problems and then decide what steps to take. When quality problems are worker caused you should be able to tell them specifically what they should do different from what they are doing now. Moreover, for a worker to be able to exercise self-control over his work, the management must provide (Stephens, 2004) the means for knowing what he is supposed to do through orientation and training and by placing clearly understandable and legible specifications and sketches of how the end product is supposed to look ; the means for knowing whether he is doing what he is supposed to, through frequent supervisory feedback as well as quality control & the means for changing what he is doing if it does not conform to what he is supposed to through either further training or job transfer, or both.
According to Dr. Juran (Stephens, 2004), if the management failed to provide any of the above essentials, resulting defects should be classified as management controllable. If the management provides all workers with the above essentials, then the resulting defects should be classified as worker caused and it is the right time to talk about motivation.
Take the following test to see if you are engaging your workers in the quality process:
a. Do workers really know what the quality objectives for their operations are?
b. Are these well documented and presented during meetings?
c. Are your workers’ inputs treated as valuable contributions to the organisation?
d. Are you giving ample input to your workers with regard to process improvement?
e. Do your workers get a say in implementing action plans and projects that improve product and process quality?
Traditional quality improvement efforts often under-estimate the importance of human behaviour. Therefore, workers must have clear understanding of the consequences of the behaviour that result in poor quality work. Worker performance should be improved in a systematic way by pointing out such behaviour through ‘fact’ and not ‘fault’ finding and then offering proper guidance.
Organisations are increasingly depending on the knowledge, skills, innovations and motivation of their workers for quality improvement.
Quality Improvement Through Raising Performance Level
What we have discussed so far addresses quality improvement when there are quality problems. But how do you improve quality by improving the level of current performance? There are two techniques or methodologies available to accomplish this, i.e., Kaizen and Six Sigma.
[a] Kaizen : One way to accomplish quality improvement through performance improvement is through a methodology known as ‘Kaizen’ (Masaaki, 1986). Kaizen is a Japanese term that means gradual unending improvement by doing little things better and setting and achieving increasingly higher standards.
Kaizen focusses on analyzing value added and non-value added work activities and eliminating non-value added work activities; Addressing ‘Muda,’ which refers to seven classes of waste, i.e. over production, delay, transportation, processing, inventory, wasted motion, and defective parts, and eliminating waste; Using principles of motion study to do a given job most efficiently; Using principles of materials handling for efficient movement and handling of materials; Documentation of standard operating procedures; Addressing the five S’s for workplace organisation, i.e. Seiko (proper arrangement), Seiton (orderliness), Seiketso (personal cleanliness), Seiso (cleanup), and Shitsuke (discipline); Visual management by means of visual displays that everyone in the plant can use for better communication; Using ‘just-in-time’ principles to produce only the units in the right quantities, at the right time, and with the right resources; Mistake proofing to prevent or detect errors and team dynamics which include problem solving, communication skills and conflict resolution.
Kaizen relies heavily on a culture that encourages suggestions by operators who continually try to incrementally improve their job or processes.
[b] Six Sigma : Quality improvement through Six Sigma is a structured method for achieving breakthrough improvements or results. Breakthrough improvement is defined as the improvement of the magnitude of at least 10 times. Quality improvement through Six Sigma uses 5 stages: Define – This stage, as the name implies, requires clearly articulating or defining what the problem is. Trying to clearly define a problem helps us understand the problem. As the saying goes “A well defined problem is a problem half solved.” Without clear understanding of what the problem is, how can it be solved? Measure – In this stage, quantitative data or information is collected about the problem.
This helps us establish where we are at present and establishes a base line; Analyze – In this stage, all the information that was collected is analyzed to understand where improvements can be made; Improve – At this stage, improvement steps are put in place and observed to make sure we are getting the improvements planned for; Control – Once satisfied that the improvement is taking place, it is necessary to put proper process controls in place.
Six Sigma uses a variety of statistical tools. Its quality improvement methodology addresses all processes in an organisation, and therefore, is quite expensive to implement. Therefore, before you decide to move on with Six Sigma, clearly understand what your quality problems are and what the ROI will be. Do not just get caught in the current fad simply to be able to say “we are implementing Six Sigma.”
The same statistical tools that are used in Six Sigma can be successfully used for quality improvement without implementing Six Sigma. For more on Six Sigma please refer to “What Is Six Sigma? Is It for Me? [StitchWorld, September 2005].
Conclusion
There is no ‘magic bullet’ that works for everyone or ‘one size fits all’ approach to quality improvement. Each organisation must find its own way to quality improvement.
In spite of all good intentions, quality improvement efforts will not be successful if there is a lack of management commitment. Management commitment means:
- Planning and implementing a program of actions for continuous improvement in quality.
- Continuous education and training of employees so that they can do their job better.
- Providing employees with proper tools and allowing them enough time so they can do better job, and recognising when good work is done.
- Breaking down barriers between departments so that people work together for a common solution or cause.
- Forming of problem solving teams made up of cross-section of various functions/departments to tackle chronic problems.
- Listening to suggestions for improvement made by people doing their jobs and prompt implementation of those suggestions accepted by management.
- Commitment of all resources (technical, financial, personnel) to improve processes.
- Explicit corporate policy that the customer is number one priority and that satisfied customers drive the business.
Some other reasons why quality efforts may fail are:
- Improvement objectives and goals are not clear
- Lack of pride in work performed and enthusiasm for improvement on workers part
- Low level of trust throughout the organisation
- Looking out for departmental interests rather than the whole organisation’s interests
- Management practicing ‘divide and rule’ strategy
Good Luck on your quality improvement journey. Remember, it is a journey without destination; it is simply a continuous journey!
Tools for Quality Improvement
The following six tools are available to help clarify thinking while undertaking quality improvement efforts.
1. Cause and Effect Diagram
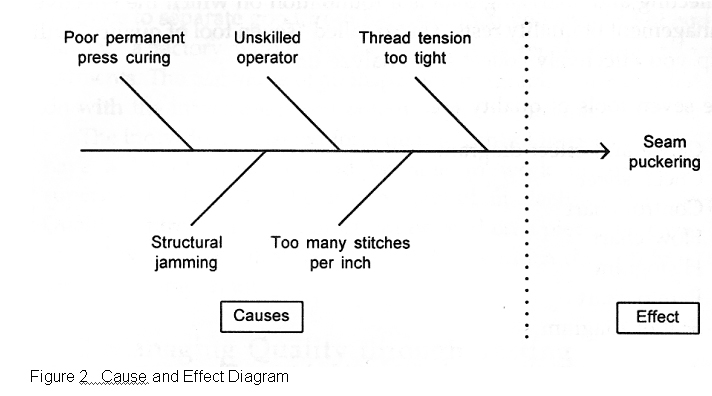
Figure 2 shows a simple cause and effect diagram which graphically illustrates the relationship between a given outcome (effect) and all the factors (causes) that influence this outcome. This diagram is also known as ‘fishbone’ diagram because it looks like skeleton of a fish, or ‘Ishikawa’ diagram, named after a Japanese quality expert who came up with this concept. The idea is first to identify and state the problem, which is in essence an effect of something that happened in a process, and think through various causes that may have resulted in an undesired effect. Drawing a cause and effect diagram helps one think systematically and logically.
2. Brain Storming
Brainstorming is a technique for generating creative ideas when the best solution is not obvious. For a brain storming session:
- The ideal group size is 4 to 10.
- The meeting place is comfortable, casual and right sized.
- Generate a large number of ideas. Don’t inhibit yourself or others. Just let the ideas out. Record each idea without editing it. Even though an idea may seem half-baked or silly, it has value. It may provoke thoughts from others.
- During the brainstorming session, no one should criticise ideas because that will inhibit participants from sharing their ideas. There will be ample opportunity later on to sift through all ideas and accept only those that make sense.
- Encourage everyone in the group to speak.
- Let the ideas incubate. Giving them time to blossom. Be creative.
3. Flow Chart or Process Diagram
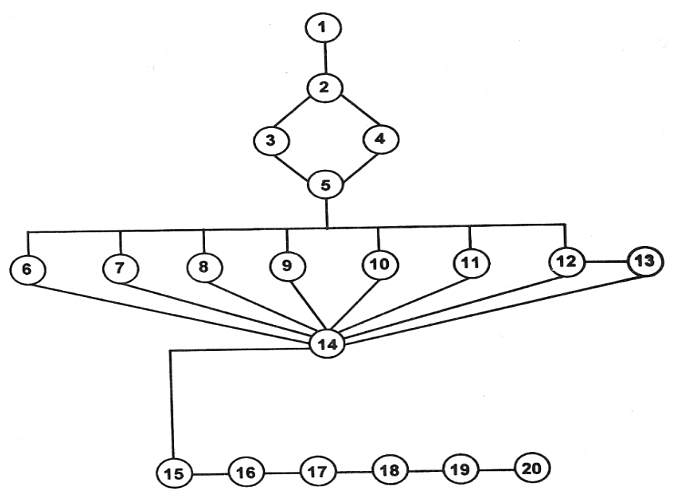
A flow chart is a schematic diagram of a process including all the steps or operations in the sequence as they occur. Constructing a flow chart will help you clarify various steps involved in a process and result in a better overall understanding of that process to identify and solve its problems.
A flow chart can help understand the complete process, identify the critical stages, locate problem areas, and show relationships between different steps in a process. Figure 3 is an example of a flow chart.
4. Histogram
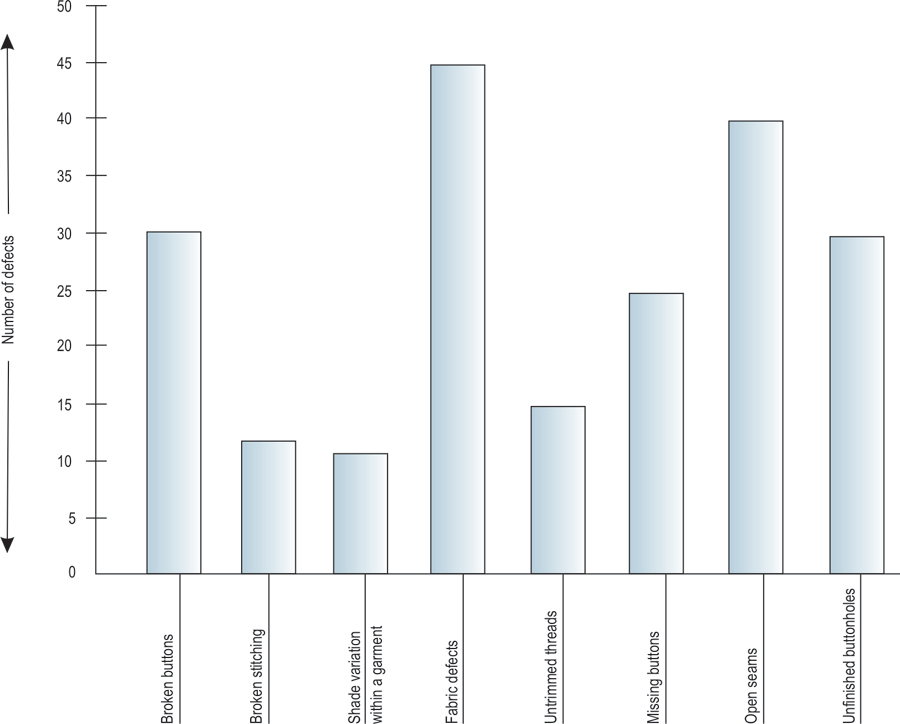
A histogram is a bar chart or a bar graph. It is a graphical depiction of a number of occurrences of an event. For example, if you were to draw a histogram of the data contained in Figure 1, it would look like figure 4.
A histogram simply shows the distribution of sample data and gives some idea about variability of that data. It is a graphic summary of variation in a set of data and a simple but powerful tool for elementary analysis.
A histogram can help understand the total variation of a process, and quickly and easily determine the underlying distribution of a process.
5. Pareto Chart
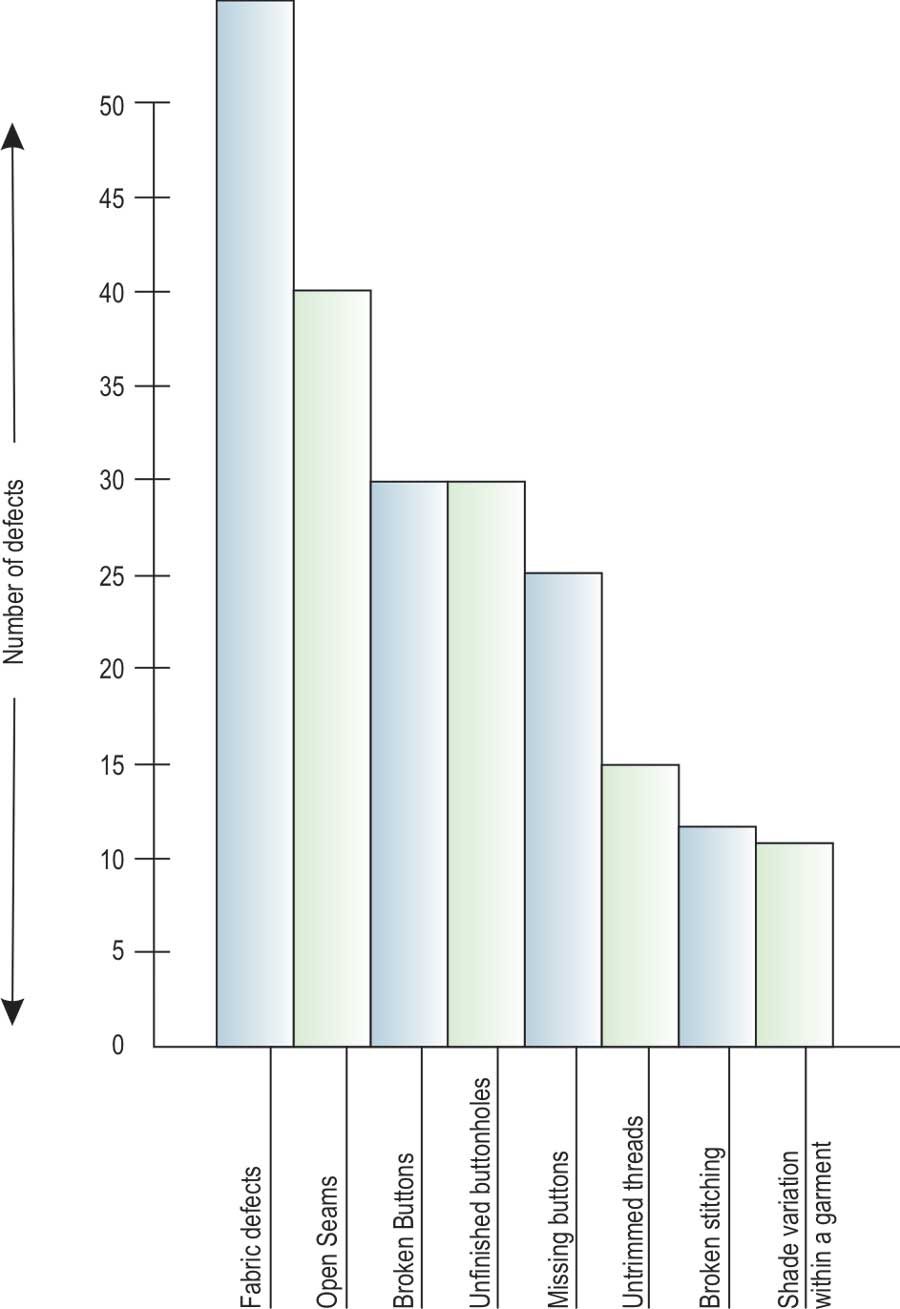
A Pareto chart is nothing but a histogram where a number of occurrences of an event are arranged in descending order. For example, a Pareto chart of the data contained in Figure1 will look like Figure 5.
Dr. Juran observed in the mid-1920s, as a young engineer, that quality defects are unequal in frequency, that is, when a long list of defects is arranged in order of frequency, generally, relatively few of the defects account for the bulk of defectiveness.
Dr. Juran named this phenomenon the Pareto principle after Vilfredo Pareto, and its use in quality assurance was popularised by Juran and Ishikawa (Juran, 1975).
Thus, a Pareto chart helps identify those defects that cause most problems and by addressing those defects, most of the quality problems can be solved and improvement be made.
For example, of the 208 defects shown in the Figure 1, 56 or 30% are fabric defects. So, in this instance, it would be most effective to address fabric quality first because any improvement in fabric quality will significantly improve overall quality of the product.
Please refer the italicized text alongside Figure 1. The next defect to address should be open seams, and so forth.
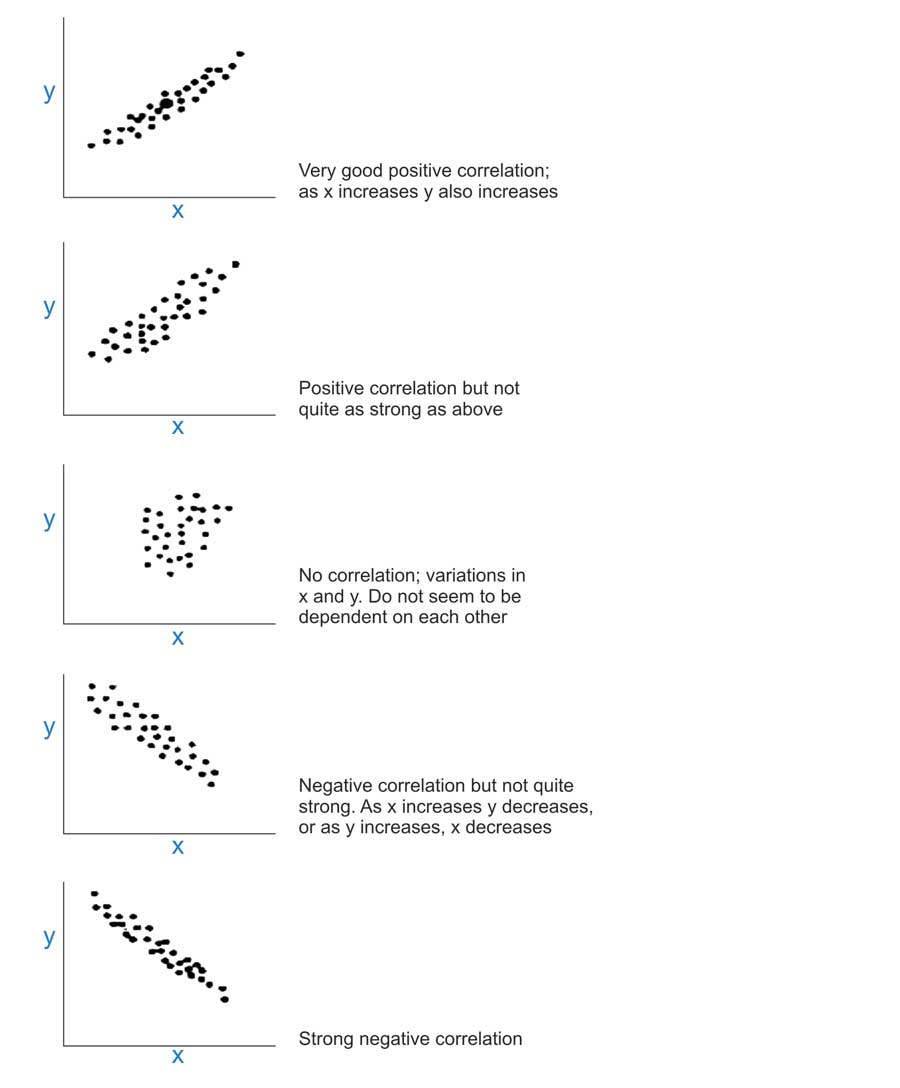
6. Scatter Diagram
A scatter diagram is a plot of one variable versus another variable, which is dependent on the other variable.
For example, yarn strength may be dependent on number of twists per centimeter.
Fabric strength may depend on the weight of the fabric, etc. By plotting one variable against another, it is easy to see their relationship, if any.
Various possible relationships between two variables are shown in the Figure 6.
By understanding this relationship it can be determined what steps to take for quality improvement.