“‘Minimize waste’, has been the mantra of garment indus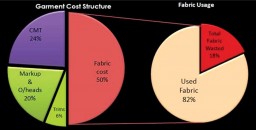 try for the past decade in order to increase bottom-line profitability. We have been educating ourselves on various innovative concepts and techniques to control the production floor but in order to plug smaller cracks, are we not neglecting the bigger holes in the system?”
Roger Thomas, Methods Apparel Consultancy India, in conjunction with OGTC, conducted a ten-week programme for cutting room improvement in eight factories in Delhi and NCR to investigate and improve fabric utilization, the single biggest contributor in garment cost.
It is a known fact that the fabric comprises at least 50% of the garment cost and the best fabric utilization is to use every inch of it, converting it into garments and ultimately into earnings.
To establish and identify the major areas of waste, two orders were thoroughly investigated in each of the factories.
The results show that of the total fabric bought for an order, only 82% is being used effectively and the remaining 18% is being lost one way or the other.
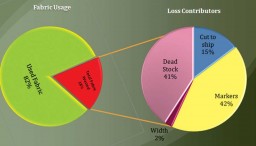 The major contributors to this loss are:
Dead Stock : The fabric that is left in the stores after the order has been shipped is known as Dead Stock. This is mostly the result of over-cautious buying.
No one wants to be blamed for short shipment and so there are lots of stages where extra percentages are added. As an example the pattern master calculates consumption on medium size (2 metre) and adds extra, approximately 10 cm, to compensate for large sizes. A further 3 to 5% is added for cutting wastages and 2% for shrinkage and defects. The fabric is ordered and a further 5% is added since the buyer allows a potential 5% to be over-shipped.
[bleft]Good marker planning can make cutting rooms 20% more productive and save at least 2% of fabric issued. But finding the most efficient markers for a given set of quantities presents a challenge for even the best cut planners[/bleft]
Cut to Ship Ratio : This ratio represents the number of garments shipped against the number of garments cut. The cut to ship ratio varies between 95% and 99%. Six of the factories achieved a ratio of 96-97% with only two of them achieving acceptable delivery percentages.
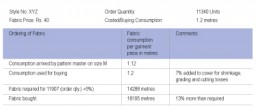
Example Consumption 2m Pattern Master 10 cm 2.1m Cutting Wastage 4% 2.18m Shrinkage 2% 2.23m Fabric required (Order Qty. = 4000 pcs.) = 8000m. Fabric bought (Order Qty. + 5% = 4200 pcs.) = 9366m.
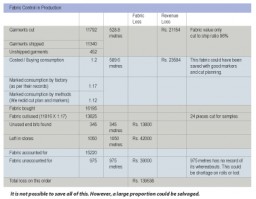
If cut to ship ratio is 97% (avg.), then 4074 garments are actually shipped. Fabric accounted for = 8148m. (Number of garments shipped X the costed consumption figure, i.e. 4074 X 2m) Fabric unaccounted for or lost =1218m.Total fabric lost = 1298m X100 =13%. 9366m Extra fabric bought = (9366m-8000m)/8000m X 100 =17%
The loss of 13% of the total fabric bought is either dead stock, lost in cutting room, lost as reject garments or arrived short on rolls from mill. However, once the shipment leaves, the companies revel in the fact that they have sent more than the ordered quantity instead of realizing the fact that they actually bought extra 5% plus the other additions [shown in the example above (total is 17%)] but not converted it into earnings. It is well understood that all fabric cannot be saved; however, realizing that all of this fabric cannot be saved, a good proportion is possible!
Because the buyers allow an extra 5% garment to be delivered, that extra metreage of fabric is being added to the purchases, costed consumption figures are rough and have some allowance in them. If the companies think about adding the extra garments to the shipment without buying fabric for them, in most cases the companies will succeed in delivering the order complete.
Markers : 7.5% of fabric was lost due to inefficient cut order planning and poor markers.
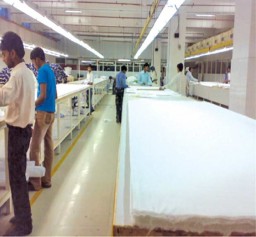
Cut Order Planning : Finding the most efficient markers for a given set of quantities presents a challenge for even the best cut planners. Good marker planning can make cutting rooms 20% more productive and save at least 2% of fabric issued. By utilizing the additional 5% that is acceptable to the buyer, the ratio can be smoothed and the number of markers reduced. This will lead to more economic consumption figures and less work, without affecting the final dispatched quantities. The concept of cut order planning is lacking in many cutting rooms. The planning that is being done is sometimes not as good as it should be.
Marker Making : CAD equipment has been in the market for a long time, many companies own CAD equipment; however it is surprising to see that after spending thousands, the equipments are not being used as well as it could be in many of the factories. Some of the companies make miniature markers and send them to the cutting room where they are ignored and inefficient manual markers are made resulting in poor fabric usage. 50 markers were checked on the automatic marker making equipment currently on the market, it was found that marker making unaided by humans can save 3.6% on an average, in certain cases savings were as high as 5%, this leaves huge room for thought and how management works to control the efficient use of this equipment.
Width Usage: Fabric supplied by power looms has considerable width variation. It is important that fabric width information is supplied to the marker making department so that markers can be made to maximize the advantages to be made. This can save a further 0.5% of the fabric in an order. None of the factories were grouping fabrics and using widths appropriately.
Other Areas of Potential Improvement:
Remnant Markers and End Bits Administration : Most factories cut garments from remnants (End bits) but they are frequently saved to cut part changes and the remaining fabric is wasted. In each factory it was made mandatory to use all the remnants to cut garments before the last marker and part changes were done only from off cuts. The final comparison between costed/buying and achieved consumption will be considerably improved.
Housekeeping : Research shows that there is direct correlation between productivity and clutter. The housekeeping in the cutting rooms was hugely improved during the project.
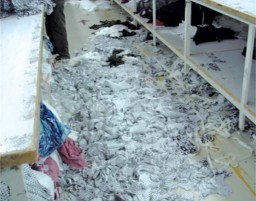
Housekeeping is a major problem in the vast majority of cutting rooms. The laying tables have been designed with shelves underneath and these shelves are used to store all sorts of pieces of fabric from current and old orders. Fabric is treated very poorly with no understanding of its importance and these shelves promote poor fabric discipline and waste. It is highly recommended that the shelves be removed. The way it is stored under the tables is similar to throwing money on the floor and expecting it to be there when you return, such is the waste.
Fabric Reconciliation : The reconciliation report is a complete summary of how the fabric was used. How much was bought, issued, laid, supplier shortages, amount unusable, end bits and off-cuts and summarizes profit and loss on each order over costed consumption. This report can assist not only in accounting fabric but also in evaluating suppliers for shortages in rolls and quality of fabric and of course in monitoring exactly how fabric is being used. These reconciliations should form a part of regular management meetings in which fabric performance against individual orders play a major part.
Costed/Buying Versus Achieved Consumption In many cases buyers are responsible for changing the style specifications at the last moment which contributes further to these variances.
There is no point in improving markers, using the width better, reducing end losses, using end bits better if you have overbought, all that it will do is add to the dead stock.
It is equally important that efficient fabric control systems are developed to monitor fabric usage from purchasing through to a final reconciliation, and how much was ‘saved’ and is now on the stockroom shelves waiting for someone to buy it at a tenth of its original cost.


